How shared scooter data quietly redraws your city’s bike map
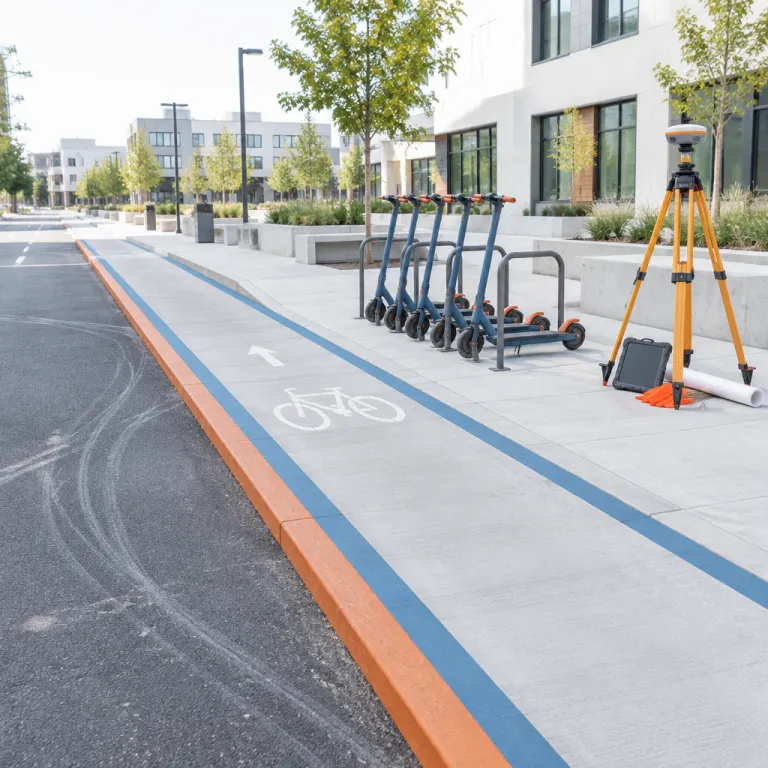
Your shared scooter ride to the bar last night did not end there. That trip sat down beside millions of other rides in a server, became mobility data, and now whispers into the ear of every planner sketching the next protected bike lane. This is how shared scooter data city bike lane planning really works, and why private riders on personal scooters rarely see their own commute reflected in the new lanes.
When a city grants an operating permit to Lime or any other scooter share company, it usually requires detailed trip data in return. Every time scooters move, the GPS pings generate trip data points that show where bikes scooters and scooters actually roll, where they slow, and where riders bail out of mixed traffic to hunt for protected lanes. Over a few months, those shared micromobility traces harden into heat maps that look objective, almost clinical, yet they mostly mirror nightlife and tourist patterns rather than daily active transportation commutes.
Planners then overlay this mobility data on existing transportation infrastructure maps. They see bright corridors of shared mobility use between downtown hotels, stadiums, and waterfronts, while the quieter bike lane that threads from a residential district to a suburban rail station barely registers. In practice, shared scooter data city bike lane planning often means that the loudest clusters of scooter share trips win the next round of protected lanes, even if those clusters say more about bar crawls than about school runs.
For an urban commuter on a personal Segway Ninebot Max G30 or Xiaomi Pro 2, that bias is obvious. You feel it every time a painted bike lane simply vanishes at the city boundary, forcing your bike scooter or electric scooter into a fast arterial road with no protected bike buffer. Shared bikes and shared scooters, by contrast, tend to stay inside the comfortable core where protected lanes and scooter lanes already exist, which then generates more data that tells cities to double down on the same corridors.
Shared micromobility operators argue that this feedback loop helps cities move quickly. They are not entirely wrong, because real time trip data from scooter share fleets can flag dangerous intersections, missing curb ramps, or broken surfaces long before a formal traffic study. Yet when shared scooter data city bike lane planning becomes the default, the quieter edges of the urban map — where many lower income riders live — wait years for a single protected bike lane or any meaningful micro mobility investment.
Heat maps, bias, and why your commute barely shows up
Look at a typical city’s shared mobility heat map and a pattern jumps out. Thick red bands trace downtown grids, entertainment districts, and waterfront promenades, while the residential streets that feed public transport hubs sit pale and underrepresented. This is not because urban commuters on private scooters, bikes, and bikes scooters do not ride there, but because their movements are not captured in the same structured mobility data streams.
Shared scooter operators like Lime, Bird, or Tier supply cities with origin destination matrices, peak hour charts, and dwell time analyses. Those datasets show where scooters cluster near transit, how long riders park near offices, and which bike lanes or scooter lanes see the heaviest shared micromobility flows. Yet the same shared scooter data city bike lane planning tools rarely ingest private trip data from personal scooters, even though those riders may log more kilometres per week than casual tourists on shared bikes.
Bias creeps in through simple economics. Scooter share fleets are densest where demand is highest and where a city permit allows enough devices to saturate the core, so the resulting trip data overrepresents central bike lanes and underrepresents peripheral bike lane gaps. When planners then prioritise protected lanes based on those heat maps, they effectively reward the same downtown corridors with more protected bike infrastructure, while the long, exposed approach to a suburban rail station remains a hostile strip of mixed traffic.
For everyday riders, this shapes safe riding practices in subtle ways. You may reroute your commute to stay on the few protected lanes that exist, even if that adds distance and time, because the safety difference between a protected bike lane and a painted gutter is the difference between relaxed riding and constant shoulder checks. Articles on smart ways to integrate scooters into daily life often assume those safer corridors exist, but in many cities they only exist where scooter share data has been thickest.
There is also a temporal bias in shared scooter data city bike lane planning. Shared scooters and shared bikes spike on weekends and evenings, so peak hour analyses can overweight leisure trips and underweight early morning commutes that start in quieter neighbourhoods. When a pilot program launches to test new protected lanes or scooter lanes, it often lands in already popular districts, which then generates more shared micromobility usage and more mobility data, while the silent, underserved corridors remain blank on the map.
When the fleet leaves but the lanes stay
Shared scooter programs are not permanent, even when the infrastructure they influence is. A city might run a two year pilot program with Lime and another scooter share operator, harvest millions of trips, then watch one or both companies exit when the permit terms or unit economics shift. The protected lanes, bike lanes, and scooter lanes built on the back of that mobility data, however, can shape transportation patterns for decades.
That asymmetry matters for safety and for equity. If a city overbuilds protected lanes in a tourist waterfront because scooter share data once showed heavy use, those lanes may feel oddly empty after the fleets shrink, while unprotected commuter corridors continue to push private scooters and bikes scooters into mixed traffic. Riders on personal scooters still face the same collision risks and insurance blind spots, which are explored in depth in analyses of the e scooter insurance blind spot after a crash, yet their routes were never central to the original shared mobility planning logic.
Fleet technology is also racing ahead. New shared scooters carry onboard sensors that detect sidewalks, measure vibration to infer surface quality, and sometimes even estimate pedestrian density, all of which feed richer mobility data back to cities. Those real time signals can flag where a protected bike lane is desperately needed or where scooter lanes are routinely blocked, but they still reflect only the paths chosen by shared micromobility users, not by the thousands of private riders on Segway Ninebot Max G30s or GoTrax XR Ultras who quietly avoid certain streets altogether.
Privacy sits uneasily in this picture. Even when operators aggregate and anonymise data, patterns can still reveal which neighbourhoods generate the most trips, how late people stay out, and how closely micromobility usage tracks income or race. When that shared scooter data city bike lane planning pipeline runs without strong community oversight, residents may feel that infrastructure decisions are being made about them, using data they never consented to share, while their own lived experience of unsafe crossings or missing bike lanes is sidelined.
For riders, the practical takeaway is simple but uncomfortable. Your safest route tomorrow may depend on a scooter share program that no longer exists, because the protected lanes you enjoy were justified by a short burst of trip data from a now vanished fleet. Meanwhile, the collision risks, folding mechanism failures, and braking limitations that affect private scooters — issues dissected in engineering deep dives on why handlebars still collapse under stress — rarely appear in the datasets that helps cities decide where to invest next.
From data driven planning to rider driven advocacy
Shared scooter data city bike lane planning does not have to sideline private riders. Open standards like the Mobility Data Specification and the General Bikeshare Feed Specification already give cities a way to retain mobility data from shared bikes and scooters while setting clearer rules on privacy and access. The next step is to let private riders contribute their own trip data voluntarily, so that the map of micromobility demand reflects more than just scooter share patterns around nightlife districts.
Some cities are experimenting with apps that let riders log trips from any bike scooter or electric scooter, whether it is a Lime device or a personal Xiaomi Pro 2. When those tools are designed well, they can merge shared mobility traces with private routes, revealing where protected lanes would unlock safer, more direct connections to public transport hubs. For this to work, though, planners must treat community input and rider reported near misses as seriously as they treat heat maps, rather than defaulting to whatever the latest pilot program generated.
For an urban commuter, advocacy can be as concrete as saving your GPS tracks and submitting them during a bike lane consultation. Show how your daily ride from a residential district to a metro station hugs the curb of a high speed road with no protected bike buffer, then contrast that with the overbuilt grid of protected lanes downtown. When enough riders share similar patterns, it becomes harder for a city to argue that scooter lanes and bike lanes should only follow the contours of shared micromobility usage.
There is also a safety culture dimension. When riders push for protected lanes, better lighting, and clearer rules for bikes scooters mixing with buses, they are not just chasing comfort, they are reducing the odds of the kind of collisions that leave gaps in official statistics but scars in real lives. Articles that unpack safe riding practices for Segway Ninebot Max G30 or GoTrax XR Ultra owners often stress lane positioning and speed control, yet those techniques work best when the underlying infrastructure respects the vulnerability of small wheel vehicles.
Ultimately, the tension is not between data and democracy, but between narrow datasets and broad lived experience. Shared scooter data city bike lane planning can help cities move faster and, in some corridors, build safer networks, but only if it is balanced with direct engagement from the people who ride every day. If you want your next protected bike lane to follow your actual commute rather than someone else’s bar crawl, you will need to be more than a data point — you will need to be a voice in the room.
Key figures shaping data driven bike lane decisions
- In many large US cities, shared micromobility systems — including scooter share and bike share — have logged tens of millions of trips, giving planners far more trip data on downtown corridors than on suburban routes (National Association of City Transportation Officials, NACTO).
- Analyses of shared mobility programs show that a majority of scooter trips cluster within a few central neighbourhoods, often within 3 to 5 kilometres of the city core, which can skew shared scooter data city bike lane planning toward already well served areas (various city transportation department reports).
- Open data standards such as the Mobility Data Specification and the General Bikeshare Feed Specification are now used by hundreds of cities worldwide, allowing them to retain mobility data from shared bikes and scooters even when individual operators change or leave the market (Open Mobility Foundation reporting).
- Surveys of urban riders consistently find that the presence of protected lanes and protected bike infrastructure is one of the strongest predictors of whether people will choose active transportation modes like bikes, scooters, and bikes scooters for daily trips under 5 kilometres (NACTO and city level mode share studies).